U.S. Infrastructure: Drinking Water
-
font size
decrease font size
 increase font size
This is the fifth article in Buildipedia's series on U.S. Infrastructure, following the January 8, 2010 feature on dams, "It’s About Dam Time!"
The American Society of Civil Engineers (ASCE) assigned the United States’ DRINKING WATER infrastructure a grade of “D-” on their 2009 Report Card for America’s Infrastructure. Easy access to fresh water is a modern convenience that we might take for granted in our daily lives.
U.S. Infrastructure Series
U.S. Infrastructure - Obvious But Unnoticed

Three Square Miles Of Concrete
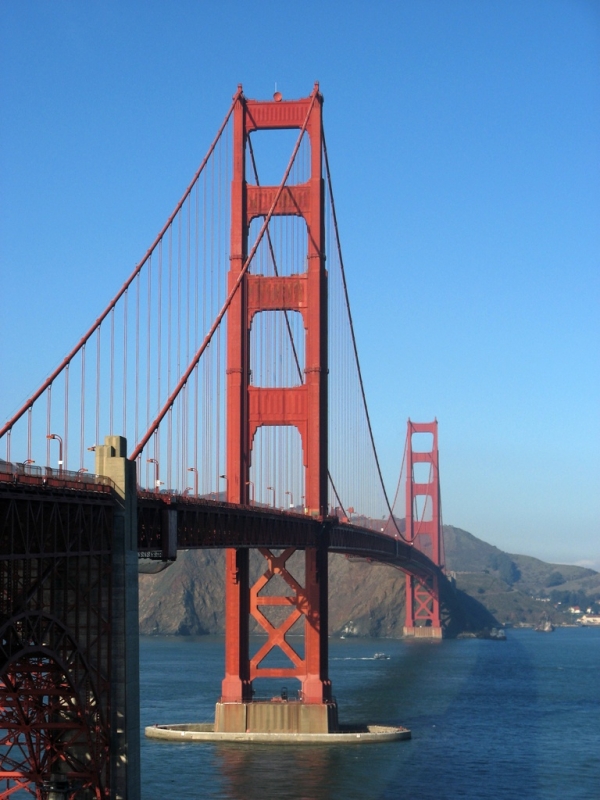
A Bridge To Everywhere
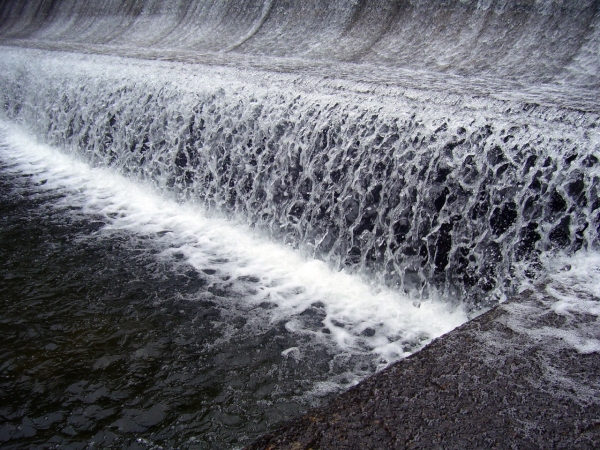
It's About Dam Time!
But water is not as plentiful or as easily obtained as we tend to believe, and the demands upon our water supply are greater than we might expect. In addition to the drinking water we need to survive, substantial clean water supplies are required for concrete mixes, soil compaction, landscaping, and hundreds of other less obviously water-dependent processes that we cover on Buildipedia.com. No homes or buildings, or any of the other infrastructure systems that we discuss, could be built or function without water. Electricity generation and water supplies are astonishingly codependent, and it is clear that one cannot exist without the other.
While this ASCE Report Card category addresses drinking water specifically, describing the United States’ water consumption in a much larger context is helpful.
Where Water Comes From
Of all the water on our planet, 97% is found in our oceans and only 3% of the total water volume on Earth is fresh water. Of this amount, 69% of the fresh water is stored as polar ice and 30% is stored as groundwater. This leaves only a small fraction -- less than 1% -- available to humans in the form of convenient surface waters (rivers, lakes, reservoirs, and streams) which supply most of our municipal fresh-water drinking systems.
U.S. Water Usage
Our current American lifestyle requires approximately 410 billion gallons of water EACH DAY, according to the most recent (calendar year 2005) figures available from the U.S. Geological Survey (USGS). Of the 410 billion gallons of water that we utilize daily, 85% is fresh water (349 billion gallons), and 15% is saline water (61 billion gallons).
Amazingly, 201 billion gallons (49%, or basically half) of the 410 billion gallons we need each day are used for “thermoelectric” or heat-sourced electricity generation (nuclear and coal-fired power plants fit into this broad category). In order to function as designed, the cooling systems (and, to a lesser degree, the steam turbines) for heat-sourced electric plants require massive volumes of water flow. Almost all of the 61 billion gallons of saline water used daily in the United States is for cooling thermoelectric power plants, most of it in coastal Florida and California. One mitigating factor in this massive use of water is that most of it is needed only for “once-through” passage in the cooling systems, and then the water is returned to its fresh or saline source, albeit at a higher temperature. Still, a large amount of cooling water has to be initially available for use in this manner, or these plants could not function, which is why they’re often constructed alongside large bodies of water. A small fraction of the thermoelectric water requirement is for fresh water that is converted to steam and used to rotate the turbines that generate most of our electricity.
Another significant draw on our water supply is irrigation. As with the generation of electricity, irrigation requires an astounding amount of water - 128 billion gallons of fresh water each day in America. This represents 37% of our national fresh water requirements. Public water supply systems require 44 billion gallons of fresh water per day. The chart below conveniently summarizes the different categories of total U.S. water consumption. Fresh water for our individual personal use, the topic of this ASCE Report Card, falls under the Public Supply category, individual domestic wells notwithstanding.
Total Water Usage in the United States(Billions of gallons per day)- 410 |
|||
|
Fresh Water |
Saline Water |
||
| Irrigation | 128 | ||
| Thermoelectric | 143 | 58 | |
| Public Supply | 44.2 | ||
| Industrial (Self-Supplied) | 18.2 | ||
| Mining | 4 | ||
| Livestock | 2.1 | ||
| Aqua Culture | 8.8 | ||
| Other | 0.7 | 3 | |
|
Sub Total |
Fresh |
Fresh Surface Water 270 |
|
| Total |
349 |
61 |
|
The chart to the right highlights the fact that the fresh drinking water flowing from our taps at home is a small fraction of the total supply we need for daily living in America. In order for us to prepare our dinners each evening, large volumes of fresh water are required... volumes that are significantly higher than we first might assume necessary, considering the water demands of irrigation and livestock. Adding neighborhoods, businesses, and utilities to undeveloped land represents an exponential increase in water needs, because it is the increase in industrial processes and electricity generation, more than just the amount of tap water flowing out of new residents’ faucets, that places a demand upon the water supply.
Small Community Water Systems are the Most Numerous
A recurring theme throughout our series of infrastructure articles is that funding shortfalls exist -- hence the low grades that appear on the 2009 ASCE Report Cards. The ASCE Report Card for Drinking Water identifies an annual funding shortfall of $11 billion throughout our water supply systems. The USGS reports that in 2005, 86% of U.S. residents received their tap water from municipal water systems, and the remaining 14% from private sources, including domestic wells. Focusing in on the Public Supply category (44 billion gallons per day) of our overall water use chart, the ASCE Report Card further describes that over 53,000 public use water systems exist in America. More than four out of five of these public use water systems serve separate populations of 3,300 people or less.
This is a significant point because when new drinking regulations are enacted, or capital repairs are required, these smaller community systems are hard pressed to individually seek out funding and provide improvements. The much fewer, but much larger, municipal water systems in this country (like the Central Arizona Project we’ll discuss next) serve most of our population, and generally have better options to obtain necessary resources.
Larger Municipal Systems - The Central Arizona Project (CAP) Example
The engineering required to bring Colorado River water into Central Arizona is truly amazing. It’s a good project to highlight as one of our major municipal water systems for at least two reasons.
First, supporting the masses of people who have moved into arid climates requires extraordinary engineering, to go along with the extraordinary water volumes we’ve already highlighted as being required to support human communities. The cost, scope, and scale of projects like this are interesting human endeavors (as is the Yangtze River diversion project underway in China, a blog topic this week on Buildipedia.com).
Second, there is only so much Colorado River water available to support current and future growth. The preservation of water rights and the competing interests of neighboring states in the southwestern U.S. are recurring news headlines. Thirty million people, or roughly 10% of the U.S. population, currently depend on the Colorado River for their existence. A review of the CAP provides a much better understanding as to why many people in the southwest states view water as their most important resource. Challenges to the Colorado River water supply system include climate change and population increases. One system advantage is that the reservoir network on the Colorado River can hold about 4 times its annual flow at maximum capacity, mainly due to the storage afforded by Lake Mead and Lake Powell. As of July, 2009, the Colorado River reservoirs are currently full to about 59% of their total capacity, reduced from being 95% full in 2000, following drier conditions experienced over the last 10 years.
While drinking water may be the most obvious water resource to us, since we interact with it daily, it represents only a small fraction of the total water we need during a typical day in the United States. Communities in arid regions are particularly vulnerable to environmental dynamics, since their water infrastructure is very specifically engineered and water is a highly coveted commodity. Healthy funding levels will always be necessary to keep water flowing in the right directions and amounts throughout the U.S.
Join us next time on Buildipedia.com for the sixth article in our U.S. Infrastructure series, Watts it Matter to You?, when we investigate the "Energy" category. We’ll have a greater appreciation for power plants in our next infrastructure article, now that we know how much water they utilize!

Andrew Kimos
Andrew Kimos completed the civil engineering programs at the U.S. Coast Guard Academy (B.S. 1987) and the University of Illinois (M.S. 1992) and is a registered Professional Engineer in the state of Wisconsin. He served as a design engineer, construction project manager, facilities engineer, and executive leader in the Coast Guard for over 20 years. He worked as a regional airline pilot in the western U.S. before joining the Buildipedia.com team as Operations Channel Producer.
Website: buildipedia.com/channels/operations